Dan Keys, CFAR Research Associate
When someone comes to a CFAR workshop, and then goes back home, what is different for them one year later? What changes are there to their life, to how they think, to how they act?
CFAR would like to have an answer to this question (as would many other people). One method that we have been using to gather relevant data is a longitudinal study, comparing participants’ survey responses from shortly before their workshop with their survey responses approximately one year later. This post summarizes what we have learned thus far, based on data from 135 people who attended workshops from February 2014 to April 2015 and completed both surveys.
The survey questions can be loosely categorized into four broad areas:
- Well-being: On the whole, is the participant’s life going better than it was before the workshop?
- Personality: Have there been changes on personality dimensions which seem likely to be associated with increased rationality?
- Behaviors: Have there been increases in rationality-related skills, habits, or other behavioral tendencies?
- Productivity: Is the participant working more effectively at their job or other projects?
We chose to measure these four areas because they represent part of what CFAR hopes that its workshops accomplish, they are areas where many workshop participants would like to see changes, and they are relatively tractable to measure on a survey. There are other areas where CFAR would like to have an effect, including people’s epistemics and their impact on the world, which were not a focus of this study.
We relied heavily on existing measures which have been validated and used by psychology researchers, especially in the areas of well-being and personality. These measures typically are not a perfect match for what we care about, but we expected them to be sufficiently correlated with what we care about for them to be worth using.
We found significant increases in variables in all 4 areas. A partial summary:
Well-being: increases in happiness and life satisfaction, especially in the work domain (but no significant change in life satisfaction in the social domain)
Personality: increases in general self-efficacy, emotional stability, conscientiousness, and extraversion (but no significant change in growth mindset or openness to experience)
Behaviors: increased rate of acquisition of useful techniques, emotions experienced as more helpful & less of a hindrance (but no significant change on measures of cognitive biases or useful conversations)
Productivity: increases in motivation while working and effective approaches to pursuing projects (but no significant change in income or number of hours worked)
The rest of this post is organized into three main sections. The first section describes our methodology in more detail, including the reasoning behind the longitudinal design and some information on the sample. The second section gives the results of the research, including the variables that showed an effect and the ones that did not; the results are summarized in a table at the end of that section. The third section discusses four major methodological concerns—the use of self-report measures (where respondents might just give the answer that sounds good), attrition (some people who took the pre-survey did not complete the post-survey), other sources of personal growth (people might have improved over time without attending the CFAR workshop), and regression to the mean (people may have changed after the workshop simply because they came to the workshop at an unusually high or low point)—and attempts to evaluate the extent to which these four issues may have influenced the results.
This study uses a longitudinal design. Everyone who attended a four-day CFAR workshop between February 2014 and April 2015 was asked to complete a pre-workshop survey about one week prior to the workshop, and everyone who completed the pre-workshop survey was asked to take a post-workshop survey about one year later (with the timing of the post-workshop survey varying somewhat for logistical reasons). This allowed us to answer questions like: on average, are people one year after the workshop happier than they were before the workshop, or less happy, or equally happy? The null hypothesis is that they are equally happy, and statistical tests can check whether the average change in happiness is significantly different from zero.
We did conduct a small randomized controlled trial in 2012, but for our current study we chose not to include a control group. Using randomized admissions for our current study would have been expensive because it requires finding people who would like to attend a CFAR workshop and then preventing them from coming for a year. The decision to instead use a longitudinal design made it feasible to have a much larger sample size. The lack of a control group raises methodological concerns (which are discussed in more detail in the final section of this post, along with methodological concerns which would be present even with a randomized control group), but we nonetheless consider these data to be useful evidence on causal questions about the effects of the workshop.
It is worth noting that causal effects of the workshop could happen by many different pathways. For example, a participant might learn a useful technique in class, have an insight during a conversation with other participants, make a new friend, make changes shortly after the workshop which have knock-on effects, later volunteer for CFAR, or have a shift in self-image simply from having attended an “applied rationality workshop.” The effects measured by this study (and the effects of CFAR that we care about) include all of these causal pathways, and not merely the effects that follow directly from learning CFAR content.
Some numbers on our sample: 196 people completed a pre-workshop survey shortly before attending a CFAR workshop and were asked to complete a post-workshop survey approximately one year later. 135 of them did take the post-workshop survey, a 69% response rate (though the sample size for most questions is between 122 and 132 because of skipped questions and people who started the post-workshop survey but did not finish it). On average, the post-workshop survey was taken 361 days after the pre-workshop survey (SD = 104, range of 190-564). The average age of participants on the pre-workshop survey was 26.8 years old (SD = 5.8, range of 18-43).
The results here are broken down into 4 categories: well-being, personality, behaviors, and productivity. We report the results on all of the questions which were included on the survey as outcome measures.1
Effect sizes are given as the standardized mean difference using the standard deviation on the pre-workshop survey. An effect size of d = 0.3, for example, means that if you took a person from the post-workshop group and put them with all of the people in the pre-workshop group, you would expect them to be 0.3 standard deviations above average in that group (which is the difference between the 50th percentile and the 62nd percentile in a normal distribution). All variables are coded such that a positive effect size indicates an improvement from pre-workshop to post-workshop.
Most statistical tests used here are paired t-tests. A paired t-test takes the difference score for each participant (post-workshop score minus pre-workshop score) and then tests if the data are consistent with the null hypothesis of a difference score of zero. Results of t-tests are reported along with the degrees of freedom (which is one less than the sample size) and the test’s p-value. We use a .05 threshold for statistical significance using two-tailed tests, and report effects as being statistically significant at the .05, .01, or .001 level. Effects with p < .10 are reported as nonsignificant trends, while effects with p > .10 are reported as “no change.”
Well-Being
The CFAR workshop is not explicitly targeted at making people happier, but one might expect an effective applied rationality workshop to increase its participants’ well-being. Well-being can be thought of as an extremely common and general goal, or as good feelings that typically result from success at accomplishing one’s goals, or as an assessment of how well one is progressing at one’s goals. Thus, we considered it worth including several measures of well-being on the workshop survey.
Happiness
The Subjective Happiness Scale is a 4-item self-report measure developed by Lyubomirsky and Lepper (1999). Happiness on this scale increased by d = 0.19 (t(128) = 3.11, p < .01).
Life Satisfaction
Life satisfaction was measured using the single question “How satisfied are you with your life as a whole?” This question, and slight variants, are commonly used in wide-scale survey research. Life satisfaction increased by d = 0.17 (t(131) = 2.08, p < .05).
Domain-Specific Life Satisfaction
After the general life satisfaction question, participants were asked to rate their life satisfaction in three domains using questions which we created: “How satisfied are you with how your life is going in each of the following domains?”
In the “romantic relationships” domain, life satisfaction increased by d = 0.15 (t(130) = 2.19, p < .05).2
In the “work / school / career” domain, life satisfaction increased by d = 0.36 (t(131) = 3.96, p < .001).
In the “friendships / non-romantic social life” domain, life satisfaction did not change (d = 0.11, t(131) = 1.32, p = 0.19).
Social Support
While not strictly a measure of well-being, the amount of social support that a person has is closely related to their quality of life in the social domain. We created a 3-item metric of social support, which asked participants to estimate 1) the approximate number of people who they interacted with in the past week, 2) the number of people who they would be willing to confide in about something personal, and 3) the number of people who would let them crash at their place if they needed somewhere to stay. Their numerical responses were then capped at 300, log transformed, and averaged into a single measure of social support.
There was no change on this measure of social support (d = 0.11, t(122) = 1.65, p = .10).
Stuckness
Participants were asked to what extent they agreed with the statement “I feel like my life is stuck.” This question (which we created) can be interpreted as a measure of something closely related to life satisfaction, with a focus on how one’s life is moving rather than on its current state.3 Feelings of stuckness decreased by d = 0.31, t(128) = 3.02, p < .01 (with a positive effect size indicating a reduction in stuckness).
Summary of Results on Well-Being
There were significant improvements on all 3 general measures of well-being: happiness, life satisfaction, and stuckness. There were also significant improvements on domain-specific life satisfaction in 2 of the 3 domains (romantic and work). There was no change in social life satisfaction or social support. The largest effects were the increase in life satisfaction in the work domain and the decrease in feeling like one’s life is stuck.
Personality
Advancing in the art of rationality involves shifts to how one thinks. There are reasons to suspect that this includes shifts along several of the dimensions that are measured by existing personality scales.
We had prior reason to suspect that the CFAR workshop had an effect on three personality variables: general self-efficacy, emotional stability, and growth mindset. That makes this survey something like a conceptual replication of those effects.4
General Self-Efficacy
General self-efficacy is the tendency to see problems as solvable, and to see yourself as capable of succeeding at the challenges that you face. One form that this attitude can take which is taught at CFAR workshops: if you notice an important problem, spend 5 minutes (by an actual clock) attempting to solve it.
General self-efficacy was measured using Chen and colleagues’ (2001) 8-item New General Self-Efficacy Scale (sample item: “I will be able to successfully overcome many challenges”).
General self-efficacy increased by d = 0.16 (t(122) = 1.99, p < .05).
Growth Mindset
Growth mindset is the tendency to see oneself as malleable and capable of improving in important ways. In some respects, it seems to be an internal analogue of general self-efficacy: I am capable of accomplishing things even if that depends on acquiring capabilities that I do not have yet. A 4-item scale of growth mindset was taken from Carol Dweck’s book Mindset (sample item: “No matter what kind of person you are, you can always change substantially”).
There was no change in growth mindset (d = 0.07, t(127) = 0.79, p = .43).
This effect size (d = 0.07) is compatible with both a true effect of zero and a true effect of d = 0.21, which was the effect size that we found on the 2013 LW census, which makes this null result somewhat difficult to interpret. The average growth mindset score before the workshop (3.04 on a 1-4 scale) was already higher than the average growth mindset score on the 2013 LW census among people who had attended a CFAR workshop (2.86), which is some evidence in favor of the model where growth mindset makes people more likely to attend a CFAR workshop.
Big Five
The Big Five personality model is widely used by psychologists to study broad tendencies in people’s personality. Most of the five factors have a plausible link to rationality. In declining order of the strength of that link (in my subjective opinion): emotional stability (sometimes called “neuroticism” when scored in the opposite direction) reflects resilience to stress and a tendency to not suffer from unhelpful negative emotions. It (along with general self-efficacy) is included among the 4 core self-evaluations that some psychologists consider to be fundamental traits which underlie a person’s ability to act effectively in the world. Conscientiousness is closely related to the ability to reliably get things done. Openness to experience is a broad factor which includes aesthetic aspects, but is also associated with intellectual curiosity and inventiveness. Extraversion seems less core to rationality, but does seem related to having a high level of social fluency which is useful for many purposes (and which is an object-level skill that gets some training at CFAR’s intensive four-day workshop). Lastly, agreeableness is related to the ability or inclination to cooperate with others, though there are also some rationality skills (such as avoiding confirmation bias and groupthink) which seem related to disagreeableness.
The 44-item Big Five Inventory (John & Srivastava, 1999) was used to measure personality on the Big Five factors.
Emotional stability increased by d = 0.13 (t(126) = 2.71, p < .01). This is consistent with our finding on the 2012 RCT.
Conscientiousness increased by d = 0.24 (t(128) = 4.38, p < .001).
Openness to experience did not change (d = 0.01, t(127) = 0.09, p = .93). Openness is sometimes separated into two facets, openness to ideas (which seems more relevant to rationality) and openness to aesthetics (which seems less relevant). There was also no change in openness to ideas (d = 0.06, t(127) = 0.87, p = .39).
Extraversion increased by d = 0.12 (t(126) = 2.82, p < .01).
Agreeableness did not change (d = 0.09, t(127) = 1.55, p = .12).
Socially Prescribed Perfectionism
Socially prescribed perfectionism is a form of perfectionism that is motivated by a desire to meet other people’s extremely high expectations. Powers, Koestner, and Topciu (2005) found that people high in socially prescribed perfectionism benefited less from implementation intentions, a technique that is taught at CFAR workshops.
We included a 5-item measure of socially prescribed perfectionism, adapted from the Multidimensional Perfectionism Scale (sample item: “Anything that I do that is less than excellent will be seen as poor work by those around me”). This measure was primarily intended to investigate whether people high in socially prescribed perfectionism would respond differently to the workshop, but it would also be interesting to see if the workshop led to a reduction in socially prescribed perfectionism.
There was no change in socially prescribed perfectionism, d = -0.07, t(127) = -0.76, p = .45 (with a negative effective size indicating an increase in socially prescribed perfectionism).
Summary of Results on Personality
Replicating our 2012 RCT, we found significant increases in general self-efficacy and emotional stability. There were also significant increases in conscientiousness and extraversion. Unlike in the 2013 Less Wrong census results, there was no effect on growth mindset. There was also no change in openness to experience (or openness to ideas), agreeableness, or socially prescribed perfectionism.
Behaviors
Many of the changes that one would hope to see as a result of an applied rationality workshop are changes in habits, skills, or other behavioral tendencies, rather than changes in personality.
We included measures of a small subset of these changes: a self-report measure of the rate at which a person’s toolkit of useful techniques is growing, a self-report measure of three useful conversational behaviors, performance measures of four cognitive biases or reasoning errors, and a self-report measure of whether a person relates to their emotions in a way that helps towards their goals.
Technique Acquisition Rate
The process of improvement in “applied rationality” involves acquiring new useful thinking skills, habits, and so on. As a self-report measure of their rate of progress in this process, participants were asked “On average, about how often do you find another technique or approach that successfully helps you at being more rational / more productive / happier / having better social relationships / having more accurate beliefs / etc.?” There were 8 response options ranging from “several times per day” to “once per year or less”.
This question was preceded by two similar questions, one which asked how often participants “read or hear about” new techniques and one which asked how often then “try out” new techniques. These other two questions helped set the context for the participant, and they allow some exploration of the process behind successful technique acquisition.
This was a conceptual replication of results of the 2013 Less Wrong census, which found that CFAR alumni reported acquiring a new technique every 81 days5, which was significantly more often than the other LWers who acquired one every 154 days.
The rate of technique acquisition increased from once every 98 days pre-workshop to once every 59 days post-workshop, d = 0.34, t(128) = 4.53, p < .001.
Looking at the process of technique acquisition (assuming a simple leaky pipeline model of “hear about” → “try” → “successfully acquire”):
- There was no change in hearing about new techniques (once per 5.7 days pre-workshop vs. once per 6.7 days post-workshop, t(129) = -1.20, p = .23).
- People tried more techniques after the workshop (once per 22 days) than before (once per 30 days), t(128) = 2.24, p < .05.
- Success rate (acquired techniques per tried technique) increased from 31% pre-workshop to 39% post-workshop, t(127) = 2.23, p < .05.
These results differ somewhat from the 2013 Less Wrong census, which found that CFAR alumni tried more techniques but did not have a higher success rate.
Use of Conversations
Recognizing your flaws, identifying opportunities for improvement, and strategizing about how to act more effectively are three examples of rationality-related behaviors that often seem to benefit from talking to other people. In order to measure the extent to which people were making use of conversations for purposes like these, we asked participants these three questions:
- Can you recall a specific example from the last week when: You had a conversation with someone about whether a specific thought, feeling, or action of yours was influenced by cognitive biases or similar forms of irrationality?
- Can you recall a specific example from the last week when: A friend told you about a trait or behavior of yours that they thought you could improve upon?
- In the last month, about how many conversations have you had about specific strategies for becoming more effective at some work-related or personal task?
For the first two questions, “Yes” was coded as 1 and “No” was coded as 0. For the third question, numerical responses were capped at 50 and log transformed.
There was a nonsignificant trend towards an increase in conversations about one’s own biases, from 56% to 64% (d = 0.17, t(128) = 1.78, p = .08). There was no change in conversations about traits that could be improved (d = -0.08, t(128) = -0.69, p = .49) and no change in the number of strategic conversations (d = -0.02, t(128) = -0.26, p = .80).
When the three questions were combined into a single scale (by standardizing each item to have a standard deviation of one and then averaging), there was also no change (d = 0.02, t(126) = 0.19, p = .85).
Cognitive Biases
The survey included measures of four cognitive biases or reasoning errors: calibration, anchoring, framing effects (involving choice vs. matching question formats), and disjunctive reasoning.
Because of concerns about practice effects if participants responded to the same questions twice, each of these questions was given to half of participants on the pre-survey and to the other half on the post-survey. Unfortunately, this reduced the statistical power to a point where we were unable to detect three of these biases in our sample.
On the measures of calibration, anchoring, and framing effects we did not find a statistically significant bias among the pre-survey group or among the complete set of participants (collapsed across the pre- vs. post-workshop variable). Unsurprisingly, there was also no significant change between the pre-workshop group and the post-workshop group. Thus, these measures are not discussed in detail here.
As a measure of disjunctive reasoning, we used a question from Toplak and Stanovich (2002): “Jack is looking at Anne, but Anne is looking at George. Jack is married but George is not. Is a married person looking at an unmarried person?” Response options were “Yes,” “No,” and “Cannot be determined.”
This is a disjunctive reasoning question because it requires considering multiple scenarios. Giving the correct answer (“Yes”) requires separately considering the case where Anne is married (and looking at unmarried George) and the case where Anne is unmarried (and being looked at by married Jack).
Including both the pre-workshop and post-workshop groups, only 39% of participants answered this question correctly. Using a two-sample t-test, there was not a significant difference between the pre-workshop group (34% correct) and the post-workshop group (43% correct), d = 0.19 (t(120) = 1.01, p = .31).
For comparison, 14% of participants in Toplak and Stanovich (2002) answered correctly and 46% of Less Wrongers answered correctly on the 2012 Less Wrong census.
Emotions Help Rather Than Hinder
We created a single item measure of how participants relate to their emotions: “When you feel emotions, do they mostly help or hinder you in pursuing your goals?” The CFAR workshop emphasizes the value of emotions as sources of data and motivation, and includes techniques for increasing the alignment between one’s emotions, goals, and behavior. Research on emotion regulation provides some of the theoretical background for this approach, with the findings that it generally is not helpful to suppress emotions and it often is helpful to reframe situations so that they elicit different emotions (Gross, 2002).
There was an increase in the extent to which participants evaluated their emotions as helping them rather than hindering them, d = 0.41 (t(129) = 4.13, p < .001).
Summary of Results on Behaviors
There was no sign of a change in cognitive biases. However, this study appears to have been underpowered for measuring cognitive biases in this population, as the sample as a whole did not show statistically significant effects of miscalibration, anchoring, or framing (choice vs. matching).
There was a strong increase in the rate at which participants reported acquiring new useful techniques, similar in size to the correlational result found on the 2013 Less Wrong census. Participants also became more likely to experience their emotions as helping rather than hindering their goals. However, there was no change in people’s tendency to engage in three useful forms of conversation.
Productivity
Working productively is one area of life where techniques covered at the CFAR workshop are readily applicable, and most participants choose to use some productivity-related issues from their life when they practice applying the techniques at the workshop. Productivity is also relatively amenable to measurement.
The effects reported above on satisfaction with life in the domain of work/school/career (d = 0.36, p < .001), general self-efficacy (d = 0.16, p < .05), and conscientiousness (d = 0.24, p < .001) provide some evidence of improvement in the area of productivity. Additionally, the workshop survey included self-report measures (which we created) of work hours, efficiency and motivation during those work hours, income, and effective approaches to working on projects.
Work Hours
Participants were asked how many hours they spent “doing productive work” yesterday (or, if yesterday was not a workday, on their most recent workday). It is not entirely clear if an increase in work hours would be a good thing; in large part this question was asked to set the context for the next two questions.
There was no change in number of hours worked, d = -0.10, t(128) = -1.00, p = .32. 6
Work Efficiency
Participants were asked to rate the efficiency of the time that they spent working yesterday, on a scale “between 100% efficiency, where you are working as productively as you’re capable of, and 0% efficiency, where you are not getting anything done” which was provided in 10% increments.
There was a nonsignificant trend towards an increase in self-reported work efficiency, from 65% efficiency pre-workshop to 69% efficiency post-workshop (d = 0.21, t(127) = 1.91, p = .06).
Work Motivation
Participants were asked to report for how many of their work hours yesterday they felt physically motivated to do the task at hand, meaning that “the thing that you were doing was the thing that you felt like doing at that moment.”
We divided this number (which participants gave as a number of hours) by the number of hours that they worked, to give a number on a 0-1 scale.
The proportion of their work time during which they felt motivated to work on the task at hand increased from 56% to 63% (d = 0.24, t(121) = 2.30, p < .05).
This question and the work efficiency question can both be considered measures of the quality of one’s work hours. If both questions are scaled from 0-1 and they are averaged together to create a single measure, the increase on that scale is d = 0.28 (t(121) = 2.56, p < .05).
Income
Participants were asked to report their income over the past year (the 365 days directly prior to completing the survey). Participants were given the option of selecting their currency, and incomes reported in non-US currencies were converted to US dollars using the exchange rates on November 30, 2015. Reported incomes were then log transformed using the equation log(income + $10,000) to reduce skew while preventing low incomes (which could have a variety of causes, such as being a student) from being given undue weight.
There was no change in income (d = 0.05, t(118) = 0.94, p = .35).7
Effective Approaches to Working on Projects
We created a 4-item self-report measure of people’s tendency to use effective approaches when working on projects. Specifically, participants were asked to rate how regularly they acted in accordance with the following statements (on a 1-6 scale from “Almost never” to “Almost always”):
- When I decide that I want to do something (like doing a project, developing a new regular practice, or changing some part of my lifestyle), I …
- …plan out what specific tasks I will need to do to accomplish it.
- …try to think in advance about what obstacles I might face, and how I can get past them.
- …seek out information about other people who have attempted similar projects to learn about what they did.
- …end up getting it done.
The four items were averaged into a single measure of effective approaches to projects.
The use of effective approaches to projects increased by d = 0.45 (t(128) = 6.19, p < .001).8
Summary of Results on Productivity
There was no change in income over this one year time period, or in the number of hours worked. There was a nonsignificant trend towards participants reporting that yesterday they worked closer to the highest level of productivity that they are capable of. There were significant increases on the other measures of what participants did while they were working (or otherwise involved in important projects). Participants reported spending a larger fraction of their working time with the feeling that the thing that they were doing was the thing that they felt like doing at that moment, using more effective approaches to working on projects, and getting more of their projects done.
These results are consistent with the findings reported earlier on increased conscientiousness, increased general self-efficacy, and higher satisfaction with one’s life in the domain of work/school/career.
General Summary
The table below summarizes the study results:
| Category | Measure | Effect Size (d) |
| Well-being | Subjective Happiness Scale | 0.19** |
| Well-being | Life Satisfaction | 0.17* |
| Well-being | Life Satisfaction: Romantic | 0.15* |
| Well-being | Life Satisfaction: Work/School/Career | 0.36*** |
| Well-being | Life Satisfaction: Social | 0.11 |
| Well-being | Social Support | 0.11 |
| Well-being | Stuckness (R) | 0.31** |
| Personality | General Self-Efficacy | 0.16* |
| Personality | Growth Mindset | 0.07 |
| Personality | Emotional Stability | 0.13** |
| Personality | Conscientiousness | 0.24*** |
| Personality | Openness to Experience | 0.01 |
| Personality | Extraversion | 0.12** |
| Personality | Agreeableness | 0.09 |
| Personality | Socially Prescribed Perfectionism (R) | -0.07 |
| Behaviors | Technique Acquisition Rate | 0.34*** |
| Behaviors | Use of Conversations | 0.02 |
| Behaviors | Cognitive Biases: Disjunctive Reasoning | 0.19 |
| Behaviors | Emotions Help Rather Than Hinder | 0.41*** |
| Productivity | Work Hours | -0.10 |
| Productivity | Work Efficiency | 0.21† |
| Productivity | Work Motivation | 0.24* |
| Productivity | Income | 0.05 |
| Productivity | Effective Approaches to Working on Projects | 0.45*** |
Table 1: Summary of Effect Sizes. All variables are coded such that positive numbers indicate an improvement from pre-workshop to post-workshop, with (R) indicating that this involved reverse scoring. Effect size is the standardized mean difference using the pre-workshop standard deviation. † p<.10, * p<.05, ** p<.01, *** p<.001.
We found statistically significant effects on many of the variables that we measured, but it is important to consider whether these results are likely to be due to a causal effect of the workshop or if there are methodological flaws which would cause these effects to be found even in the absence of any causal effect of the workshop.
In this section, we consider four methodological concerns that seem like especially plausible sources of bias in our results:
- Self-Report and Socially Desirable Responding: High scores on self-report measures may reflect participants giving the response that they see as desirable rather than them actually doing well on the construct that we are attempting to measure.
- Attrition: If the people who benefited the least from the workshop did not respond to the post-workshop survey, then the effects measured among the people who did take the post-survey could be inflated.
- Other Sources of Personal Growth: If the participants are improving over time for other reasons, then improvement from the pre-survey to the post-survey could be unrelated to the workshop.
- Selection Effects and Regression to the Mean: If participants take the pre-survey at an unusual time (such as when their life feels especially stuck), then improvements on the post-survey could reflect regression to the mean.
This section discusses the extent to which these four concerns are likely to have influenced our results, and includes several supplementary analyses that cast some light on that question.
Self-Report and Socially Desirable Responding
One clear concern about this research is the degree to which it relies on self-report measures. Further, most of these measures involved questions about relatively broad tendencies (rather than asking about concrete, observable behaviors) and asked for responses on a scale where it was easy to identify one end of the scale as being better than the other.
Many of the measures that we used have been validated by the existing research literature. For example, the Subjective Happiness Scale is correlated with reports from people’s friends of how happy they are (Lyubomirsky & Lepper, 1999). Thus, even if there is some tendency for people to respond based on how desirable the options are, we would also expect their answers to reflect the underlying construct which the scale is attempting to measure.
The relevant question, in assessing these results, is to what extent the changes between the pre-survey and the post-survey reflect changes in the underlying construct and to what extent they reflect changes in people’s tendency to give the desirable response. Because the same person is answering the same questions on the pre- and post-surveys, one might expect the tendency to give desirable responses to be similar on both surveys, and therefore to cancel out.
There is some concern that people would be especially motivated to give high responses on the post-survey, if they had the opinion that they benefited from the workshop and wanted to validate this opinion (though this is made somewhat less likely by the fact that they were asked to report on their current tendencies, and not to make comparisons with their pre-workshop selves). However, people also might be especially motivated to give high responses on the pre-survey, as they were about to attend a rationality workshop and were answering questions about themselves to the people who were going to run that workshop.
The measures that seem most likely to show an increase after the workshop due to socially desirable responding are those where participants’ opinions about what response is desirable changed because of the workshop. For example, my impression is that CFAR workshops increase participants’ tendency to believe that it is a good idea to “try to think in advance about what obstacles I might face, and how I can get past them” and that it is desirable to arrange it so that your emotions help (rather than hinder) you in pursuing your goals. Thus, it seems reasonable to put less stock in this study as evidence that people actually changed the extent that they plan for obstacles in advance, and are helped rather than hindered by their emotions, compared to other measures which showed similar changes.
The experimental design which is typically used to reduce this concern is to use a control group which receives a placebo treatment. This design is infeasible given that our intervention is an intensive workshop. A randomized control group which received no intervention would not provide a similar advantage, since we are most concerned about socially desirable responding from people who have attended the workshop.
Another approach to reducing this concern is to rely on peer report rather than self report. We have been conducting a peer survey of CFAR workshop participants, which involves sending surveys about the participant to 2 of their friends, both before the workshop and again approximately one year later. We are in the final stages of data collection on those surveys, and will report the results once the data analysis is complete.
Attrition
People who begin a study but do not complete it are a concern for any research with a longitudinal design, because the people who complete the study (and thereby provide researchers with data that they can use) are not necessarily representative of the people who started the study. That is, attrition creates the possibility of nonresponse bias. For example, some drug treatment programs report an extremely high success rate among people who finish the program only because the people who relapse almost all drop out of the program.
Unlike in the case of drug relapsers, a person who did not benefit from the CFAR workshop may still be fairly likely to respond to the post-workshop CFAR survey. A 69% response rate is within the norm for this type of survey-based longitudinal research, and nonresponse can occur for a variety of reasons (e.g., being busy, disliking the hassle of filling out a half-hour survey). Still, the 31% attrition rate does raise some questions about what results would have been found if the whole pre-survey sample of 196 people had completed the post-survey. Taking the results at face value implicitly assumes that there is no difference between those who did complete the post-survey and those who did not, which seems implausible, since we would generally expect some correlation between how much a person benefited from CFAR and how willing they are to complete a survey for CFAR.
We could make the pessimistic assumption that the nonrespondents had zero net change, which would imply that the actual effect sizes are only 69% as large as the effect sizes reported here (since there was a 69% response rate). I suspect that this is too pessimistic, though it is worth noting that it still is not a lower bound—presumably there are some people who got worse over the course of a year, and one might expect them to be especially unlikely to take the post-survey.
One way to estimate the size of the effect of attrition is to look at the order in which the people in each workshop cohort took the post-survey. It seems likely that nonrespondents have more in common with the last people to take the survey (who received multiple reminders) than with the first people to take the survey immediately after it was sent out. Below is a graph of effect size vs. response order.
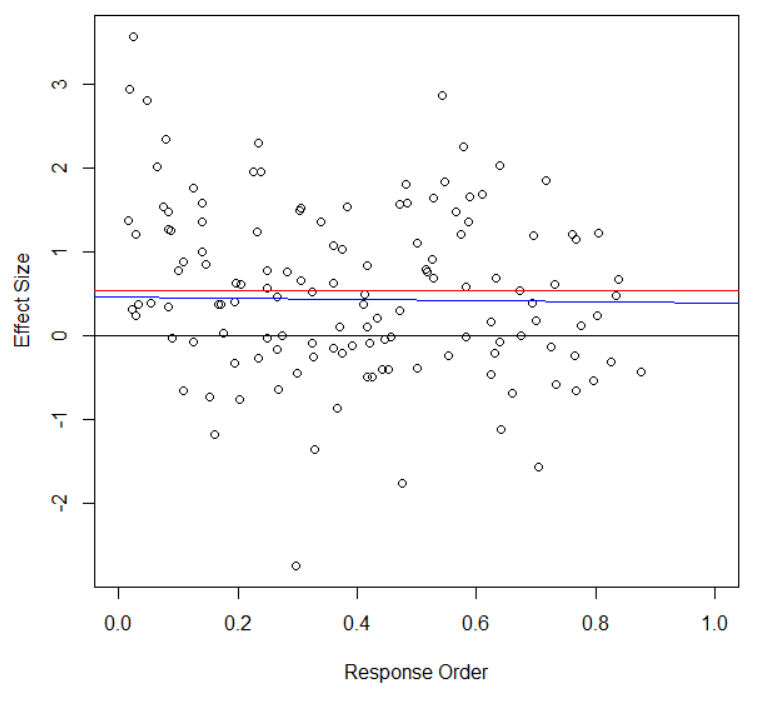
Figure 1: Effect Size by Response Order. The graph includes the sample mean (in red) and the best fit regression line for the participants with Response Order of at least 0.10 (in blue).
Effect size is based on a composite measure of the variables that had statistically significant effects (where 0 = no change from pre-workshop and SD = 1).9 Response order is scaled from 0 to 1, where 0 is the first person from each workshop to complete the survey and 1 would be the last person from the workshop if everyone completed the survey (the blank space on the right side of the graph is a result of having a response rate below 100%). The red line shows the mean among everyone who took the survey (0.54 standard deviations above zero), and the blue line is a best-fit linear regression line when excluding the first 10% of respondents.
The apparent pattern is that the effect size was higher among the first 10% of respondents, and then relatively flat (or trending slightly downward) among the rest of respondents. If we extrapolate the slight downward trend to fill in the missing data from nonrespondents (by fitting a linear regression line to everyone except the first 10%, as shown in blue), the implied effect size is 0.51 for the whole group of 196 participants who completed the pre-workshop survey, which is only slightly less than the observed 0.54 effect size for the 135 participants who took the post-workshop survey.10
An alternative way to estimate the effect of attrition is to pick a subset of nonrespondents and make an extra effort to cause them to complete the post-survey. We did this as well, focusing on the two most recent workshops (January 2015 and April 2015). These workshops already had a 77% response rate (probably because of improvements to our method of soliciting responses), and after extra cajoling of the nonrespondents we were able to increase the response rate to 88% (42/48). The average effect size for participants of the January 2015 and April 2015 workshops (with 88% response rate) was 0.54, which is the same as the 0.54 effect size for all 135 respondents (with 69% response rate).
It appears that attrition probably inflated our effect sizes by only a modest amount.
Other Sources of Personal Growth
The primary weakness of longitudinal studies, compared with studies that include a control group, is that they cannot easily distinguish changes due to the intervention from changes that would have occurred over time even without the intervention. It is possible that the people who attended the CFAR workshops would have experienced increases in self-efficacy, well-being, emotional stability, and other variables regardless of whether or not they attended a workshop.
Most of the variables that showed increases among CFAR workshop participants do not tend to increase over time among this age group. Happiness (Stone et al., 2010), life satisfaction (Qu & de Vaus, 2015; Stone et al., 2010), emotional stability (Soto et al., 2011; Srivastava et al., 2003), and extraversion (Soto et al., 2011; Srivastava et al., 2003) do not increase on average over a person’s 20s. Conscientiousness does increase (Soto et al., 2011; Srivastava et al., 2003), but only by about d = 0.03 per year, which is much less than the d = 0.24 increase that we found about one year after the workshop.
One might suspect that people who chose to attend an applied rationality workshop are different from the general population, in a way that would involve a larger increase over time on variables like these. One way to estimate the size of this effect is to look at the correlation between age and the outcome variables on the pre-survey. If CFAR participants are coming from a population whose self-efficacy is increasing with age (for example), the older people in that group should have higher self-efficacy than the younger people. (Though this relationship is attenuated by the fact that workshop attendance involves a filter, and that age is an imperfect proxy for the amount of time that a person has spent heavily focused on personal growth).
Age was essentially uncorrelated with participants’ overall score on the variables that increased after the workshop, r(132) = .07, p = .41.11 Three of the twelve pre-workshop variables did have a statistically significant correlation with age: quality of hours worked (t(120) = 2.27, p < .05), general self-efficacy (t(131) = 2.26, p < .05), and conscientiousness (t(134) = 2.03, p < .05). Each additional year of age predicted a d = 0.03 increase in quality of hours worked, a d = 0.03 increase in general self-efficacy, and a d = 0.03 increase in conscientiousness.
Another way to get evidence on how much our population of participants is improving over time (independent of the workshop) involves looking at how much time passed between the pre-survey and the post-survey. Conveniently, there was a large amount of variance in this time gap (mean = 361 days, SD = 104, range of 190-564) because we did not make it a priority to send out the “one year” followup survey exactly one year after the workshop, and we also recently chose to reduce the length of the time gap to 6 months. If people are improving over time for reasons unrelated to the workshop, then we would expect a much larger improvement from people who took the post-survey 15 months after the pre-survey than from people who took the post-survey after only a 6 month gap. This time gap was uncorrelated with overall effect size (r(134) = -.05, p = .55) and slightly in the direction of a smaller effect size for people with a larger time gap.12
Including a control group in the research design would have allowed for more confident conclusions, but it seems relatively unlikely that the survey results are primarily capturing personal growth over time which would have occurred even without the workshop.
Selection Effects and Regression to the Mean
A related limitation of longitudinal research is that the study may begin at an unusual time in the participant’s life, which is then followed by changes over time simply due to regression to the mean. It is difficult to study treatments for depression using a longitudinal design (without a control group), for example, because depressive episodes typically last for a period of months, so a group of participants who start out depressed can be expected to get better regardless of the treatment.
In the case of a CFAR workshop, one might worry that people tend to choose to attend a rationality workshop at an unusual time in their life (especially on the dimension of feeling good about the direction that their life is headed). One also might worry that feelings of anticipation in the week before a workshop might influence a participant’s state of mind as they take the pre-survey (e.g., they might be excited or nervous). The practical aspects of preparing to go to a workshop (e.g., getting ready to travel and miss a couple days of work) might also make the week before a workshop an unusual time (especially for measures of the quantity and quality of work hours).
The first of these three sources of unusualness strikes me as the most concerning to the results taken as a whole. There is some reason to suspect that people will tend to decide to come to a CFAR workshop when they are at a relatively high point (e.g., feeling especially optimistic about what they can accomplish and motivated to acquire exciting new tools). There is also some reason to suspect that people will tend to come to a CFAR workshop at a relatively low point (e.g., feeling like their life is stuck and grasping for something that might help get them unstuck). If either of these tendencies dominates, then we might expect to find effects on many of the measures in this study (such as those related to well-being, productivity, and self-efficacy) due to regression to the mean in the absence of a causal effect of the workshop. People who come in at a relatively high point would be expected to show declines, and people who come in at a relatively low point would be expected to show improvements.
This concern is somewhat attenuated, because many CFAR workshop participants sign up months in advance of their workshop. This gives them time to regress towards their baseline state after they decide to come to a workshop and before they fill out the pre-workshop survey.
In order to collect more information on the likely direction and strength of this effect, I polled the CFAR staff on the question of whether participants tend to arrive at the CFAR workshop at a relatively high point or a relatively low point, without telling them the reason for the poll. The average answer was slightly on the side of thinking that participants arrive at a relatively high point.13 This result suggests that our best guess is that the effect sizes given here are relatively unaffected by regression to the mean on this dimension, or perhaps are slight underestimates, though a significant amount of uncertainty remains.
Conclusion
CFAR has described its long-term aim as creating a community of people with competence, epistemic rationality, and do-gooding who will be able to solve important problems that the world faces. This longitudinal study of workshop participants represents one attempt to try to collect information about our progress on some substeps of this long-term project.
On several different measures, we found that CFAR alumni had changed from how they were before the workshop in ways that seem related to increased competence, productivity, or personal effectiveness. These included changes on personality scales (general self-efficacy, conscientiousness), changes on reports about their behavior (quality of hours worked yesterday, technique acquisition rate, use of effective approaches to working on projects), and changes related to how they engaged with their emotions (emotional stability, experiencing emotions as helping rather than hindering them).
The overall change was substantial enough to be apparent on broad measures of happiness and life satisfaction. Life satisfaction was especially likely to increase in the domain of work/school/career, which suggests that these broad increases in well-being may be related to an increase in competence.
We are currently working on our plans for what to measure in the upcoming year, and hope to continue to gather data that will flesh out more of the picture of what impacts CFAR has on the people who become involved in its trainings.
Chen, G., Gully, S. M., & Eden, D. (2001). Validation of a new general self-efficacy scale. Organizational Research Methods January, 4, 62-83.
Dweck, C. S. (2006). Mindset: The new psychology of success. New York: Random House.
Gross, J. J. (2002). Emotion regulation: Affective, cognitive, and social consequences. Psychophysiology, 39, 281-91.
John, O. P., & Srivastava, S. (1999). The Big-Five trait taxonomy: History, measurement, and theoretical perspectives. In L. A. Pervin & O. P. John (Eds.), Handbook of personality: Theory and research (Vol. 2, pp. 102–138). New York: Guilford Press.
Lyubomirsky, S., & Lepper, H. S. (1999). A measure of subjective happiness: Preliminary reliability and construct validation. Social Indicators Research, 46, 137-155.
Powers, T. A., Koestner, R. & Topciu, R. A. (2005). Implementation intentions, perfectionism, and goal progress: Perhaps the road to hell is paved with good intentions. Personality and Social Psychology Bulletin, 31, 902-912.
Qu, L. and de Vaus, D. (2015). Life satisfaction across life course transitions. Australian Family Trends, 8.
Soto, C. J., John, O. P., Gosling, S. D. & Potter, J. (2011). Age differences in personality traits from 10 to 65: Big Five domains and facets in a large cross-sectional sample. Journal of Personality and Social Psychology, 100, 330-348.
Srivastava, S., John, O. P., Gosling, S. D., & Potter, J. (2003). Development of personality in early and middle adulthood: Set like plaster or persistent change? Journal of Personality and Social Psychology, 84, 1041-1053. (Includes a table of Big Five personality by age.)
Stone, A. A., Schwartz, J. E., Broderick, J. E., & Deaton, A. (2010). A snapshot of the age distribution of psychological well-being in the United States. Proceedings of the National Academy of Sciences, 107, 9985-9990.
-
The survey also included several demographic questions which are not discussed here, including questions about the participant’s involvement in the rationality community. Additionally, several questions were added or removed from the survey while this study was in progress, and are not reported on here. Six questions which were on the original (February 2014) version of the survey were removed beginning with the June 2014 cohort in order to make the survey briefer, one more question was removed beginning with the November 2014 cohort, and one new question was added beginning with the January 2015 cohort. ↩
-
Exploratory analysis suggests that the increase in life satisfaction in the romantic domain was primarily due to an increase in the percent of people who were in a romantic relationship. The percent of people in a romantic relationship increased from 58% pre-workshop to 67% post-workshop, t(130) = 2.61, p < .01. Among those who were not in a relationship, life satisfaction in the romantic domain on a 1-7 scale was 2.52 pre-workshop and 2.62 post-workshop. Among those in a relationship, it was 5.63 pre-workshop and 5.64 post-workshop. ↩
-
“I feel like my life is stuck” is also somewhat related to self-efficacy, and in our 2012 RCT we treated it as a general self-efficacy item. ↩
-
The 2012 RCT found significant (p < .01) increases on brief measures of general self-efficacy and emotional stability. It is important to seek replication for those effects because the previous survey had a small sample size and a large number of outcomes variables, which increases the chance of a false positive and will tend to inflate the effect size on variables that are found to be significant. On the 2013 Less Wrong census, there was a significant association between growth mindset and whether a person had attended a CFAR workshop, d = 0.21 (t(1347) = 1.98, p < .05), but this result was only correlational and could result from people high in growth mindset being more likely to choose to attend a CFAR workshop. ↩
-
Statistical tests were conducted using the 1-8 scale. For ease of interpretation, results are reported here as days per technique. The means on the 1-8 scale correspond approximately to geometric means in days per technique. The results reported here for the 2013 Less Wrong census differ from the results that were posted on Less Wrong in 2014 because the results reported in 2014 controlled for other variables and the results reported here do not. ↩
-
On the work hours, work efficiency, and work motivation questions, we removed from the sample one participant who reported more than 24 hours of work, since their interpretation of the question differed from ours. On the work efficiency and work motivation questions, we also removed one participant who reported less than 1 hour of work, since those measures are much less meaningful with a small denominator. On the work motivation question, we also removed 2 participants who reported more motivated hours than total hours of work. ↩
-
We repeated the analysis of income while excluding all participants who reported that they were a student on either the pre-survey or the post-survey. The results were extremely similar (d = 0.06, t(68) = 0.75, p = .45). ↩
-
If analyzed separately, three of the four items on the measure of effective approaches to working on projects were statistically significant (planning specific tasks, planning for obstacles, and getting it done) while one was not (seeking information about other people). Planning for obstacles is the item which was most directly covered at the workshop, and it also had the largest effect size of the four items (d = 0.48). ↩
-
The overall measure of effect size included 12 variables, with a preference for including composite variables rather than individual items. These variables were: happiness, life satisfaction, domain-specific life satisfaction (an average of life satisfaction in the 3 domains), stuckness (reverse-scored), general self-efficacy, emotional stability, conscientiousness, extraversion, technique acquisition rate, emotions help rather than hinder, quality of work hours (an average of efficiency and motivation), and effective approaches to projects. For each of these 12 measures, we created a variable representing the post-workshop minus pre-workshop difference score, and then rescaled it to have a standard deviation of 1. Missing values were coded as 0 (meaning no change from pre-survey to post-survey). These 12 variables were averaged for each participant, and the resulting variable was rescaled to have a standard deviation of 1. This is the overall effect size measure that was used. (The results are extremely similar if missing values are coded as the scale mean rather than as 0.) ↩
-
For the participants with response order of at least 0.10, the best fit line (shown in blue in Figure 1) is:
Effect Size = 0.46704 – 0.06985 * (Response Order)
This line implies an average effect size of 0.43 for the 90% of the original sample with response order of at least 0.10. For those with response order below 0.10, the average effect size was 1.29. The implied effect size for the whole group is therefore 0.9 * 0.43 + 0.1 * 1.29, which equals 0.51. ↩
-
This overall score metric was created in much the same way as the overall effect size metric described in 9, using the same 12 variables. It used the pre-workshop scores rather than the difference scores, and missing data was replaced with the sample mean rather than 0. ↩
-
This pattern of results (overall effect size not significantly correlated with time gap, and very weakly in the direction of smaller benefit with larger time gap) continues to hold after controlling for potential confounds: response order (described earlier), workshop order (coded as 1 for February 2014 and 9 for April 2015), and workshop attrition rate (the percent of participants from a person’s workshop cohort who did not respond to the post-survey). ↩
-
I emailed the CFAR staff asking them to give a rating on a -10 to 10 scale, where -10 means that there is a strong tendency for participants to show up at a relatively low point, 10 means there is a strong tendency for them to show up at a relatively high point, and 0 means they tend to show up at their average level. Five staff members responded, with ratings of +3, -4, +3, -2, and +2 (average of 0.4). All five staff members also emphasized the uncertainty of their guess. ↩